AIOTA Opportunity Engine
every market, one evidence-based view
Forex
Crypto
Stock

The Opportunity Engine scans crypto, forex, commodities and stocks around the clock, scores every instrument on technical, fundamental, positioning, sentiment and macro evidence, and shows you what matters in plain words. Every signal it uses is tested on years of price history first, and the results are published, good or bad.
Why we built it
Most traders juggle a dozen tabs: a charting tool, a news feed, an economic calendar, on-chain dashboards, company filings, social sentiment. Each tells part of the story, none of them tells you which part to trust. The Opportunity Engine brings those pieces into one place and adds the step that is usually missing: proof. Before a signal is allowed to influence a score, we check how it actually behaved in the past.
What it covers
Each market has its own ranked table, and every instrument has its own analysis page
How an opportunity is scored
Every instrument receives an Opportunity score and a direction (bullish or bearish) for three horizons you can switch between:
The score combines several families of evidence. Which families count, and how much, depends on the market:
Technical
structure, trend, key levels and patterns from our own technical engine (see below)
Fundamental
for stocks, company financials from official filings; for crypto, size and maturity, supply dilution and developer activity; for currencies, interest-rate differences and the economy behind each currency
Positioning
what large players are doing, for example the weekly CFTC Commitments of Traders report for currencies and commodities
Sentiment & news
the tone of recent news and market mood
Macro
the wider backdrop, such as central-bank policy, inflation and the overall risk regime
Alongside the score you get a Conviction reading (how strongly the evidence agrees) and a short, readable list of what supports the idea and what to watch out for. No black box: you can always see why an instrument ranks where it does
One page per instrument
Open any coin, currency pair, commodity or stock and you get a full analysis page with six tabs:
A technical engine with 14 modules
Our technical engine analyses every instrument on five timeframes: 1 hour, 4 hours, daily, weekly and monthly. It runs 14 analysis modules and draws their results straight onto the chart:
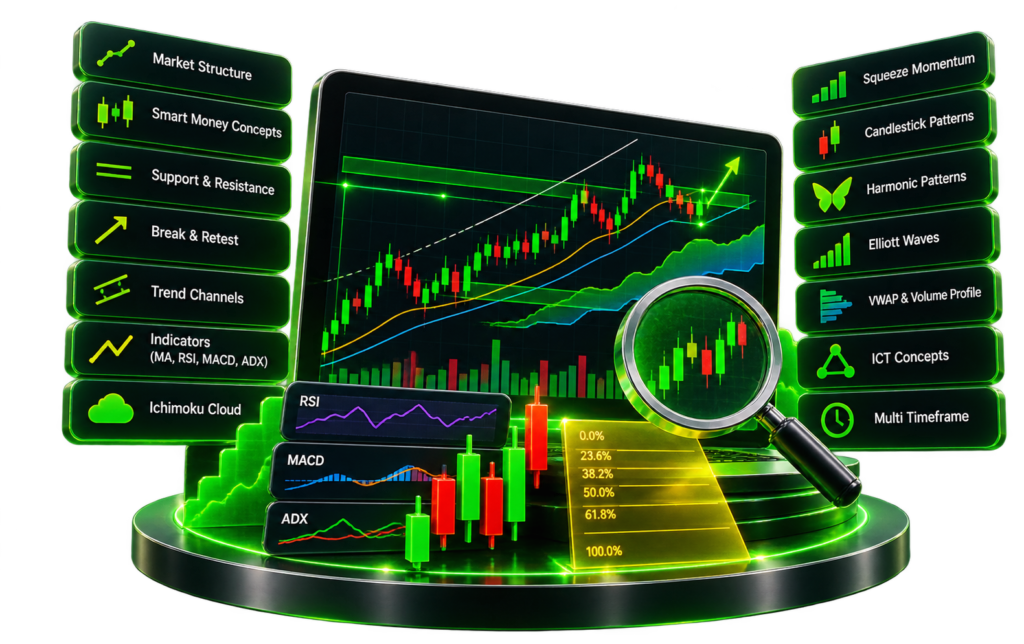
Hourly charts are refreshed every hour, and only fully closed candles are used, so a signal never appears and then disappears mid-candle
Every signal is tested before it counts
This is the heart of the Opportunity Engine. For every type of signal, on every timeframe and market, we go back through years of history and ask a simple question: after this signal appeared, within the next 10 candles, did price move one average candle range (ATR) in the signal's favour before it moved one range against it?
We then compare that hit rate with random entries taken in the same market condition: uptrend against uptrend, downtrend against downtrend. This matters, because many patterns look impressive only because the market around them was already moving. A signal earns the label Validated only if all of these hold:
Signals that do not pass are clearly labelled Not validated or No proven edge. They are never dressed up as winners. The same test also removes signals: when we examined our combined multi-factor signals, none met the bar, so none of them is presented as a validated signal
A public track record
The Track record section is open to everyone. It shows how validated signal types and research-backed strategies have performed on historical data, compared with a random or market benchmark, and it updates automatically as new data arrives. Results are shown honestly, including their limits. For example, results for a list of today's top coins look better than they really were, because coins that failed in the past are no longer on the list, so we present those results relative to the average coin rather than as raw returns
Cryptocurrency
Every 15 minutes the engine collects tokens that are currently being paid-promoted on DexScreener, the tokens most likely to be pushed at retail traders. Each one is checked against transparent risk rules (how new the token is, its market value and liquidity, extreme 24-hour price moves, sellers outnumbering buyers, trading volume that looks like wash trading, and missing website or social links) and given a risk level with the reasons listed. The engine then records what happened to the price 24 hours and 7 days after promotion, building a live record of how promoted tokens really perform
A ranked view of decentralised-exchange liquidity pools, with liquidity, trading volume and, where the data allows, an estimated yearly fee return, so you can compare pools on what they actually earn rather than on advertised numbers
Forex & commodities
Stocks
For New York-listed companies, fundamentals come from official SEC filings. London and Indian stocks are covered with prices, the full technical engine and scoring. Their fundamental data is being expanded
Everyday tools
Free preview and full access
Search, the price chart of every instrument, the public track record, and research results.Preview: free visitors can see that opportunities exist without seeing the full answer, for example the scores of the top 3 picks in each market without their names, fresh validated signals without the instrument, the first rows of the Risky Tokens list, and market tables with the top ranks locked
Names, scores, rankings, reasons, trade plans, every technical module, all signals and every section. Locked data is removed on our server, not just blurred on your screen